One cap for every agent run: telling a busy queue from a broken one
My task runner limits concurrent agent runs with a single global number, not a quota per project. That makes a queued project look stalled, so here are the four signals that tell saturation apart from a real failure.
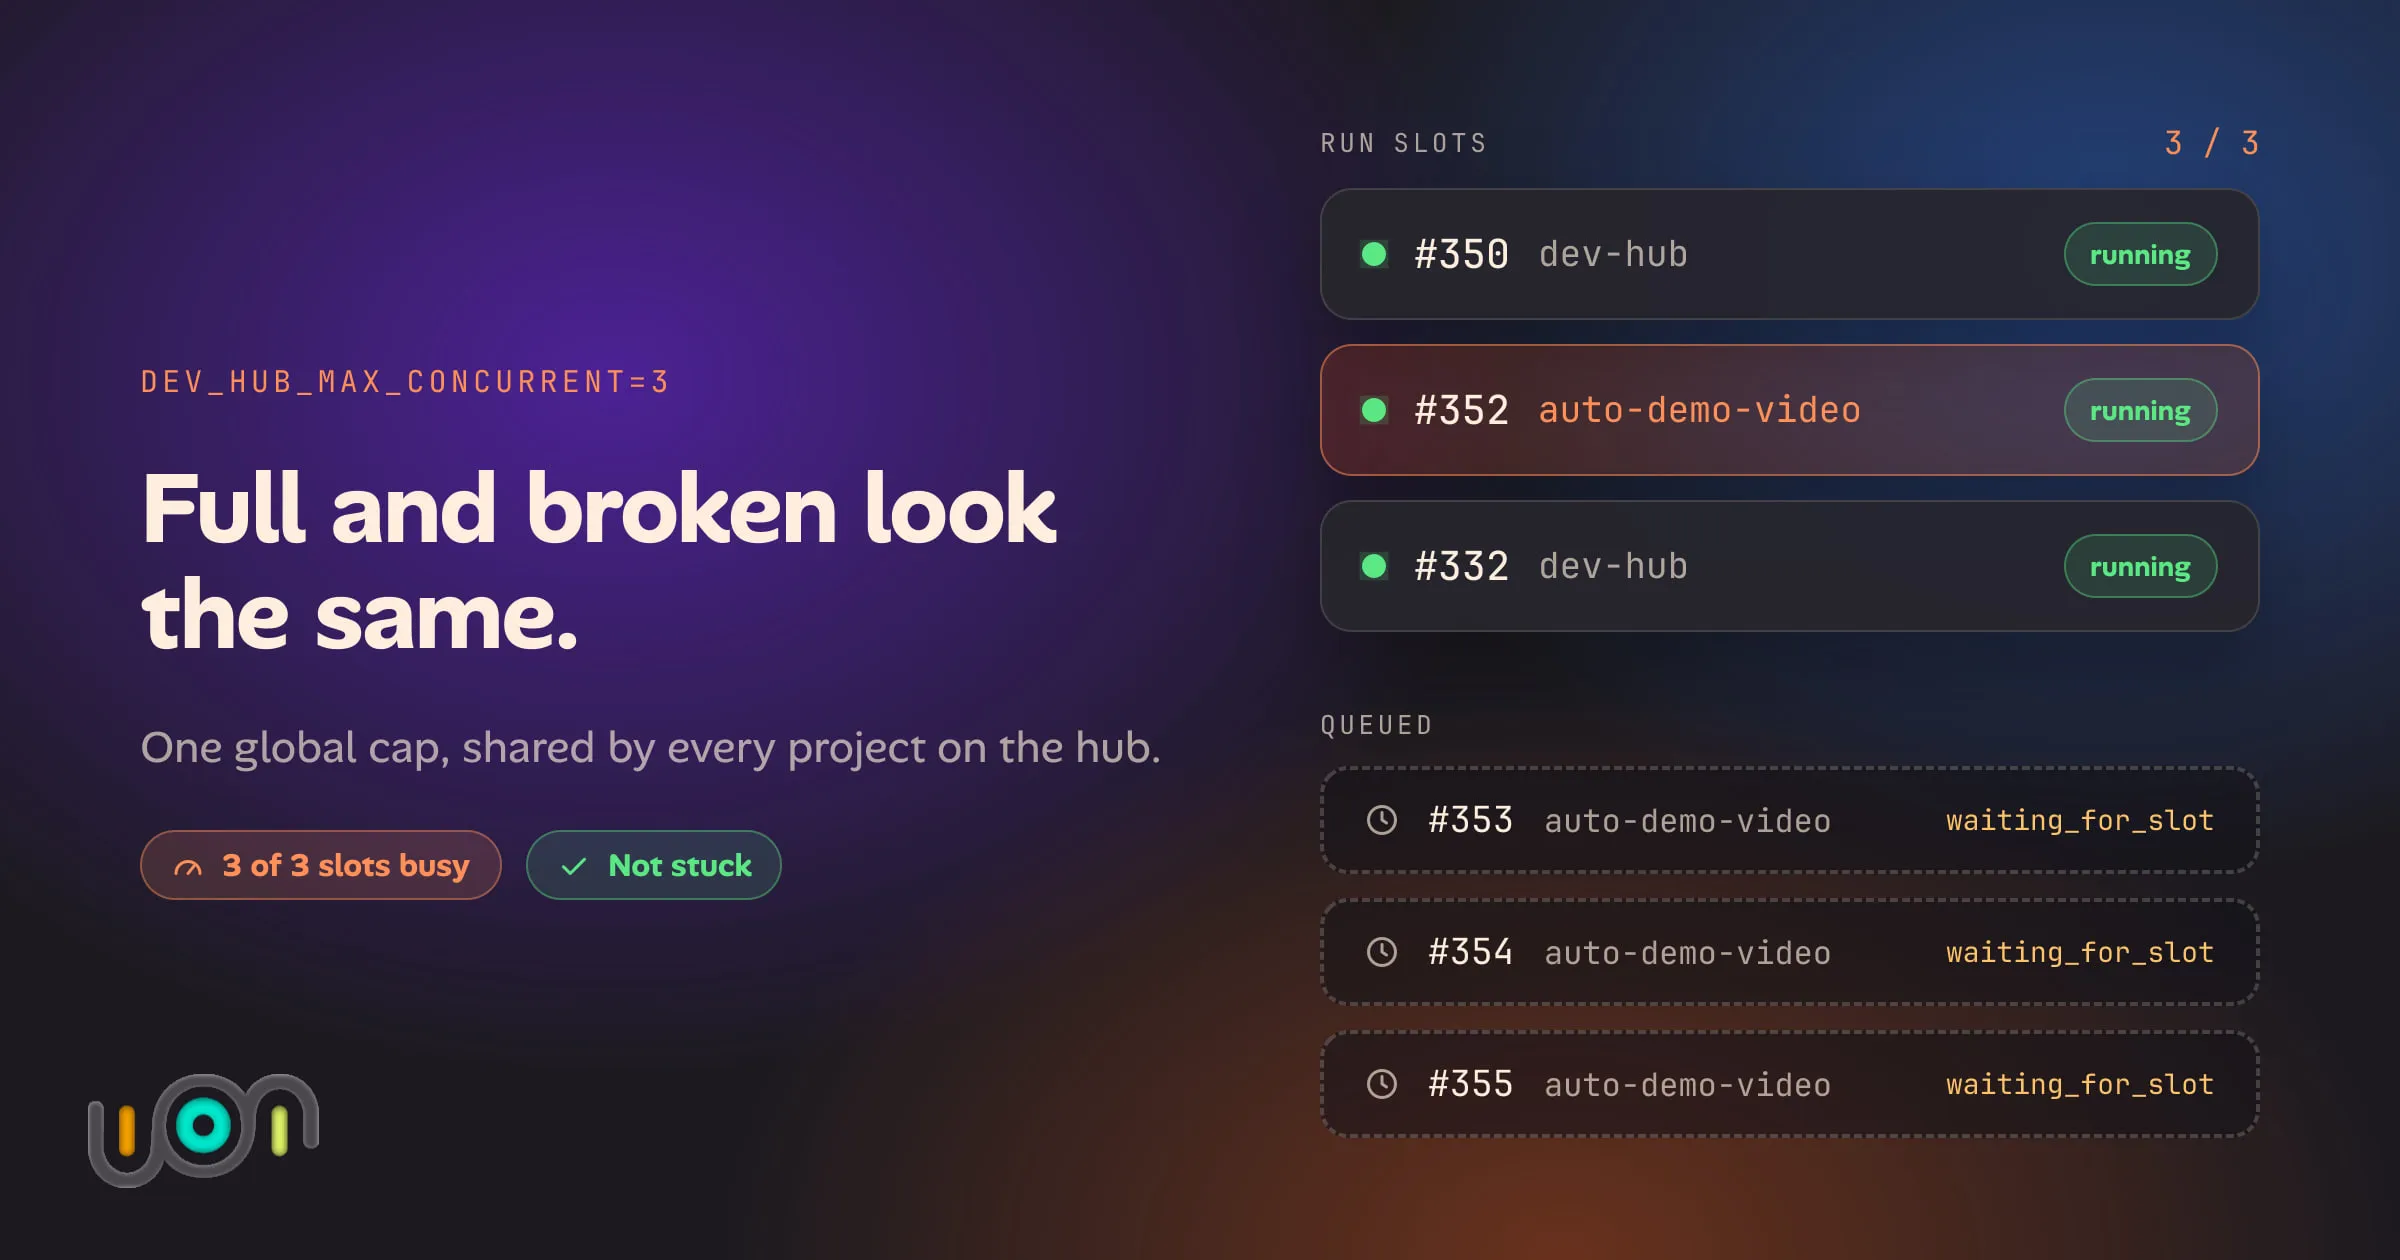
I run a small local control plane called ion. It holds a kanban board per project, and a poller that dispatches tasks marked ready to a coding agent, in its own git worktree, unattended. Yesterday one of my projects had a single task running and three siblings sitting in Todo, all correctly assigned, none of them blocked. Nothing had moved in twenty-five minutes.
The question I asked was the wrong one: “is the runner stuck?” It was not. It was full — and being full and being broken looked identical from where I was standing.
One number, shared by everything
The dispatch cap is a single environment variable, DEV_HUB_MAX_CONCURRENT,
defaulting to 3. There is no per-project quota anywhere in the code. Everything
heavyweight the hub can start counts against that one number:
| Kind of run | Counts against the cap |
|---|---|
| Autonomous task runs from the poller | yes |
| Manual “Run” button runs | yes |
| Chat sessions and their continuations | yes |
| Merge runs | yes |
The count itself is authoritative from the database, not from whatever handles the current process happens to be holding: it counts run rows marked running whose owner process is still alive, and takes the max of that and the in-memory count. That detail exists because an earlier version trusted memory, and a restart could quietly double the real concurrency.
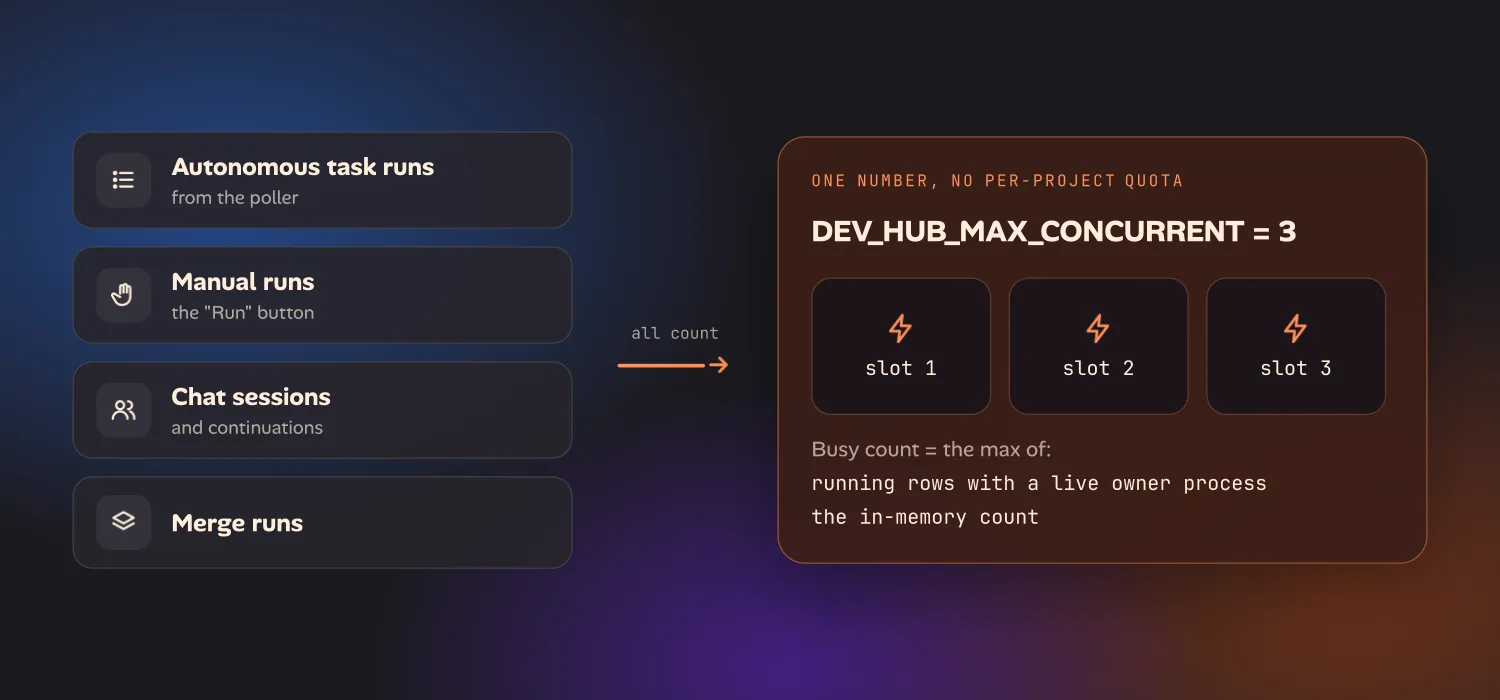
So the shape of the problem is: one project’s queue can be starved entirely by runs belonging to other projects. That is not a bug in the dispatcher. It is the dispatcher working, and me reading a global resource as a local one.
Here is what the three slots actually held at the time. One task of mine was running; the other two slots belonged to a completely different project.
#350  dev-hub          running
#352  auto-demo-video  running     ← the one project I was looking at
#332  dev-hub          running
#353  auto-demo-video  queued  (waiting_for_slot)
#354  auto-demo-video  queued  (waiting_for_slot)
#355  auto-demo-video  queued  (waiting_for_slot)
Task #352 had itself waited about twenty-five minutes before dispatching. It finished and moved to Review while I was busy investigating whether it was stuck.
Four signals that tell the difference
None of the above is visible from a board that shows one card in progress and three in Todo. What I actually needed was for “busy” to be observable. There are four places the hub says it, and they answer different questions.
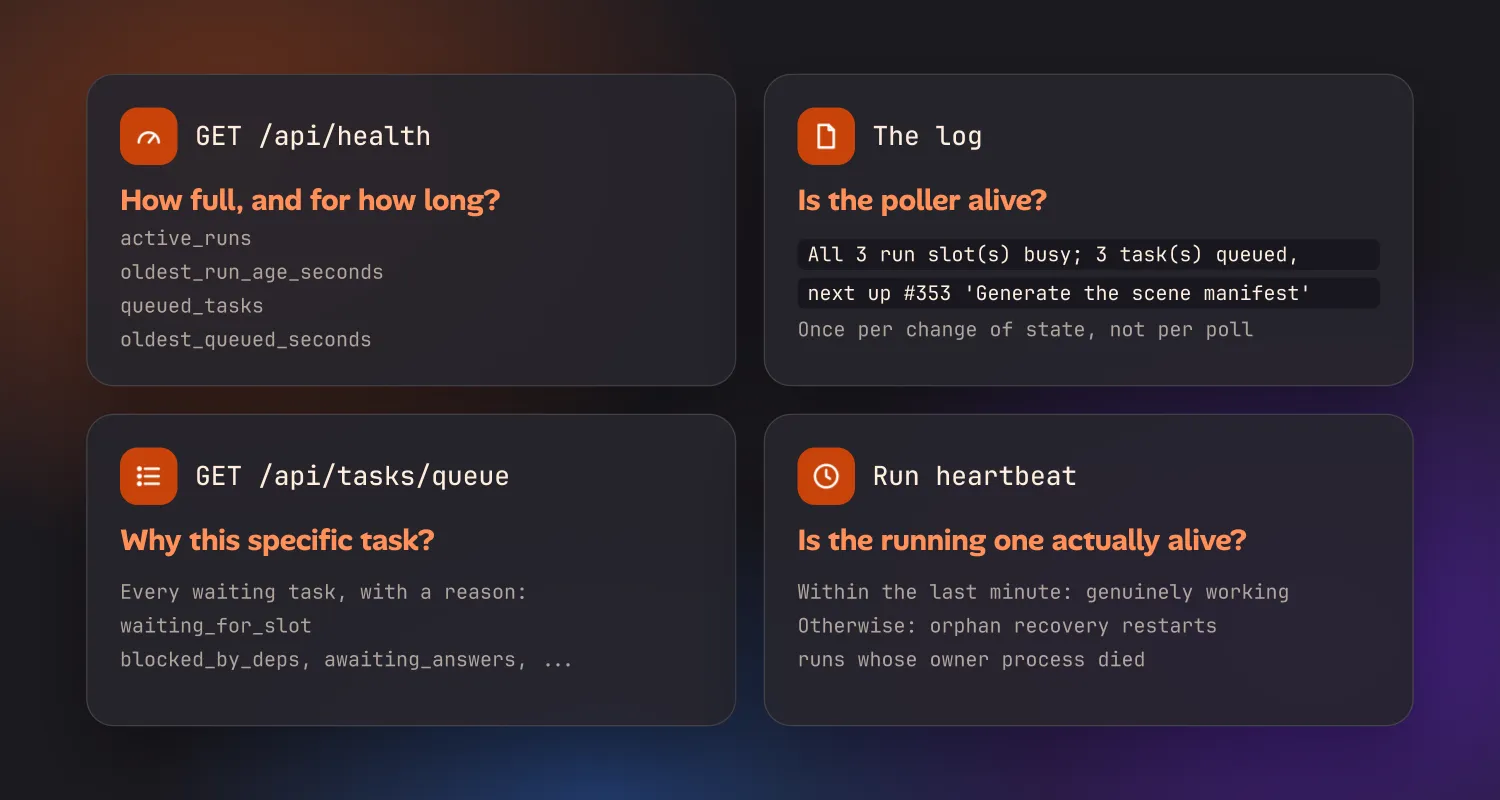
The health endpoint answers “how full, and for how long”. GET /api/health
reports active_runs, oldest_run_age_seconds, queued_tasks and
oldest_queued_seconds. Active runs at the cap with a queue depth that is growing
is saturation, full stop. A queue that is growing while active runs sit below the
cap is the interesting case — that is the one worth debugging.
The log answers “is the poller alive”. On each change of state the hub writes one line:
All 3 run slot(s) busy; 3 task(s) queued, next up #353 'Generate the scene manifest'Once per change, not once per poll, so it does not drown the log. If that line is there, the poller is running and deliberately waiting. Its absence during a full queue is the real alarm.
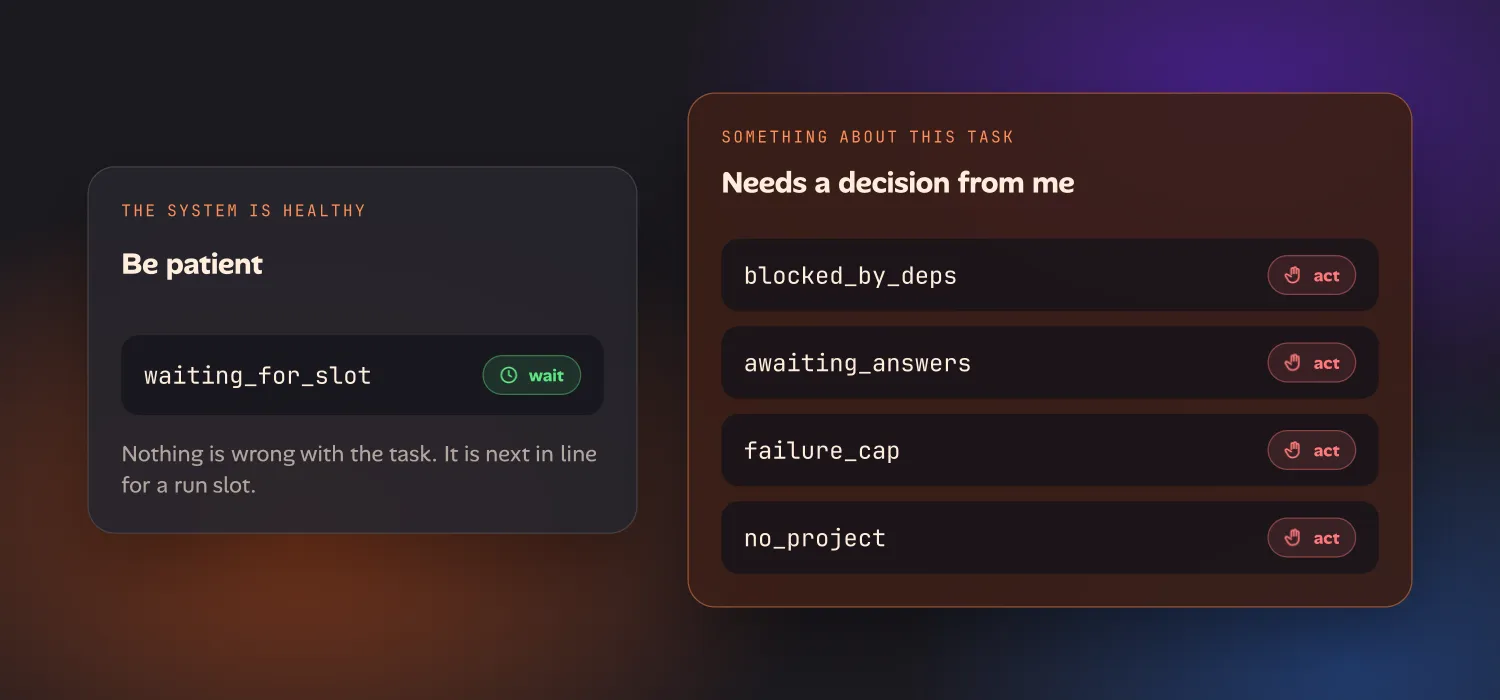
The queue endpoint answers “why this specific task”. GET /api/tasks/queue
lists every waiting task with a reason, and the reasons are not
interchangeable — waiting_for_slot means the system is healthy and I should be
patient, while blocked_by_deps, awaiting_answers, failure_cap and
no_project each mean something about that task needs a decision from me. When it’s
awaiting_answers, the question can be answered
from your Apple Watch. Lumping
these into one “pending” state is exactly the mistake that made the board
unreadable in the first place.
The heartbeat answers “is the running one actually alive”. Each run updates a heartbeat timestamp. Within the last minute means the run is genuinely working; otherwise the orphan recovery picks it up and restarts runs whose owner process died. This is the only one of the four that can distinguish a wedged run from a long one, which matters because a wedged run holds a slot forever and turns a temporary saturation into a permanent one.
Fixing it, and why I am not fixing it differently
Two levers, both immediate. Raise the cap in the service’s environment and restart it:
DEV_HUB_MAX_CONCURRENT=5
launchctl kickstart -k gui/$(id -u)/<label>
Or close idle chat sessions, which frees slots without a restart. Most of the time the second one is enough, because the slots are held by conversations I finished with an hour ago.
What I did not do is add a per-project quota, which was my first instinct and is the wrong shape. The cap is not modelling fairness between projects; it is modelling the capacity of one laptop. Three concurrent agent runs means three sets of API calls against shared rate limits, three agent processes competing for CPU and memory, and three git worktrees being written to. Splitting that budget per project does not create more of any of those. It just guarantees that an idle project reserves capacity a busy one could use, which is the failure mode of every static partition ever built.
The generalisable bit
If you are building anything that dispatches agents, even the do-it-yourself kind where a Mac mini runs Claude Code around the clock, the lesson is not about the cap. Any orchestrator has one somewhere. It is that a queue which is merely full and a queue which is broken produce the same observable: nothing appears to be happening.
Make the waiting explicit. Say how many slots are busy, say which task is next, say why each waiting item is waiting, and distinguish “the resource is contended” from “this item needs you”. I could have inferred all of that from the database in a couple of queries. I should not have had to, and now I don’t.